Monitoring Scheduler Runs
Each scheduler maintains a complete history of its executions. The run history page provides aggregate statistics and a detailed log of every run, including its status, duration, token usage, and cost.
Viewing Run History
To open the run history for a scheduler, click ⋮ on its row in the Schedulers list and select View details.
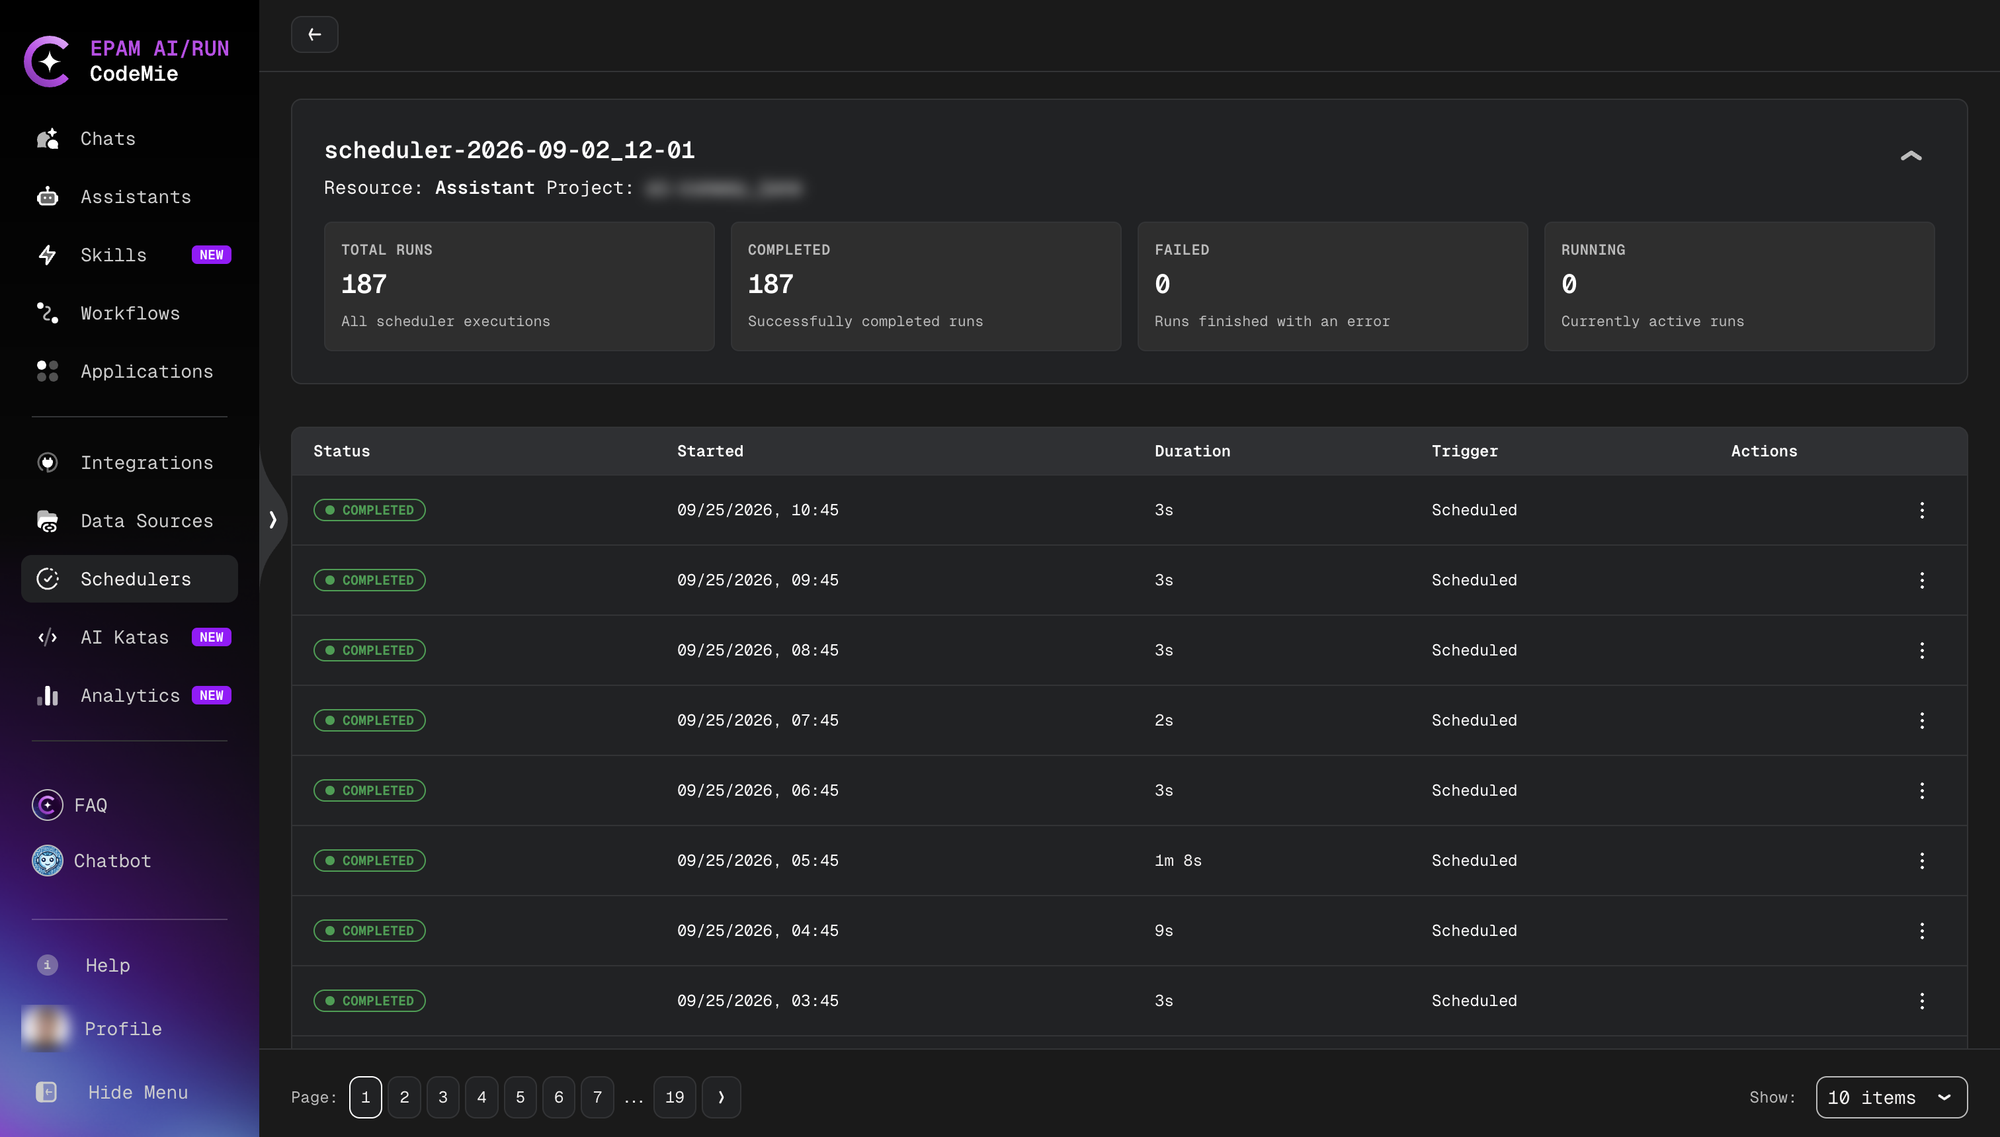
The page header shows the scheduler name, the resource type, and the project.
Statistics
Four summary tiles at the top display aggregated metrics for the scheduler:
| Metric | Description |
|---|---|
| Total Runs | Total number of executions, including completed, failed, and running |
| Completed | Number of runs that finished successfully |
| Failed | Number of runs that ended with an error |
| Running | Number of currently active runs |
Runs Table
The table lists individual executions in reverse chronological order. Each row shows:
- Status — Completed (green) or Failed (red)
- Started — Date and time the run began
- Duration — How long the run took to complete
- Trigger — How the run was initiated (
Scheduledfor automatic runs) - Actions — Per-run action menu
Filtering Runs
Runs can be filtered by status (Completed, Failed, Running) using the filter controls. Pagination is available for schedulers with many executions.
Run Actions
Click ⋮ on a run row to access per-run actions:
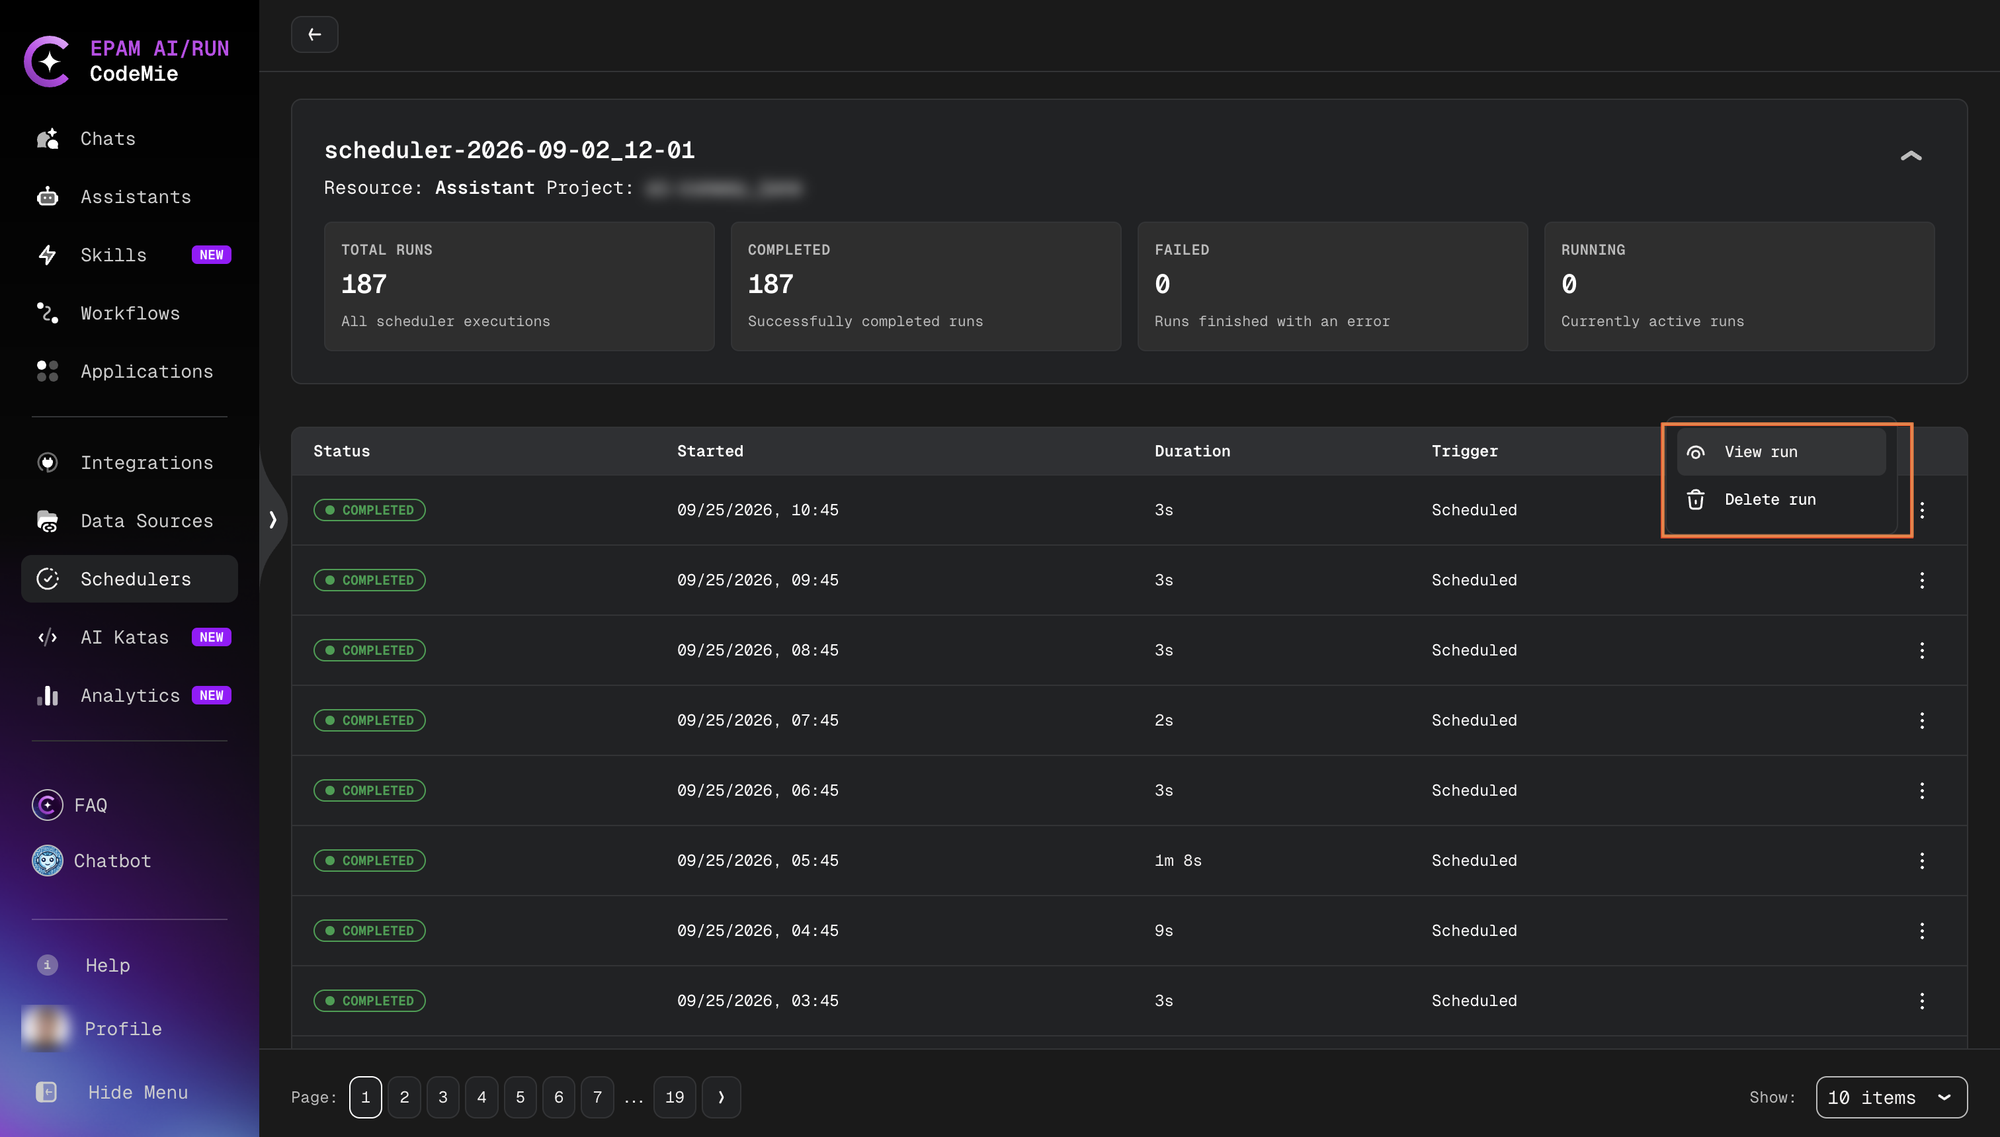
- View run — Open the Run Details page for that execution.
- Delete run — Permanently remove the run record. The statistics cards update immediately to reflect the deletion.
Run Details
Clicking View run opens the Run Details page, which provides a full breakdown of the execution.
Successful Run
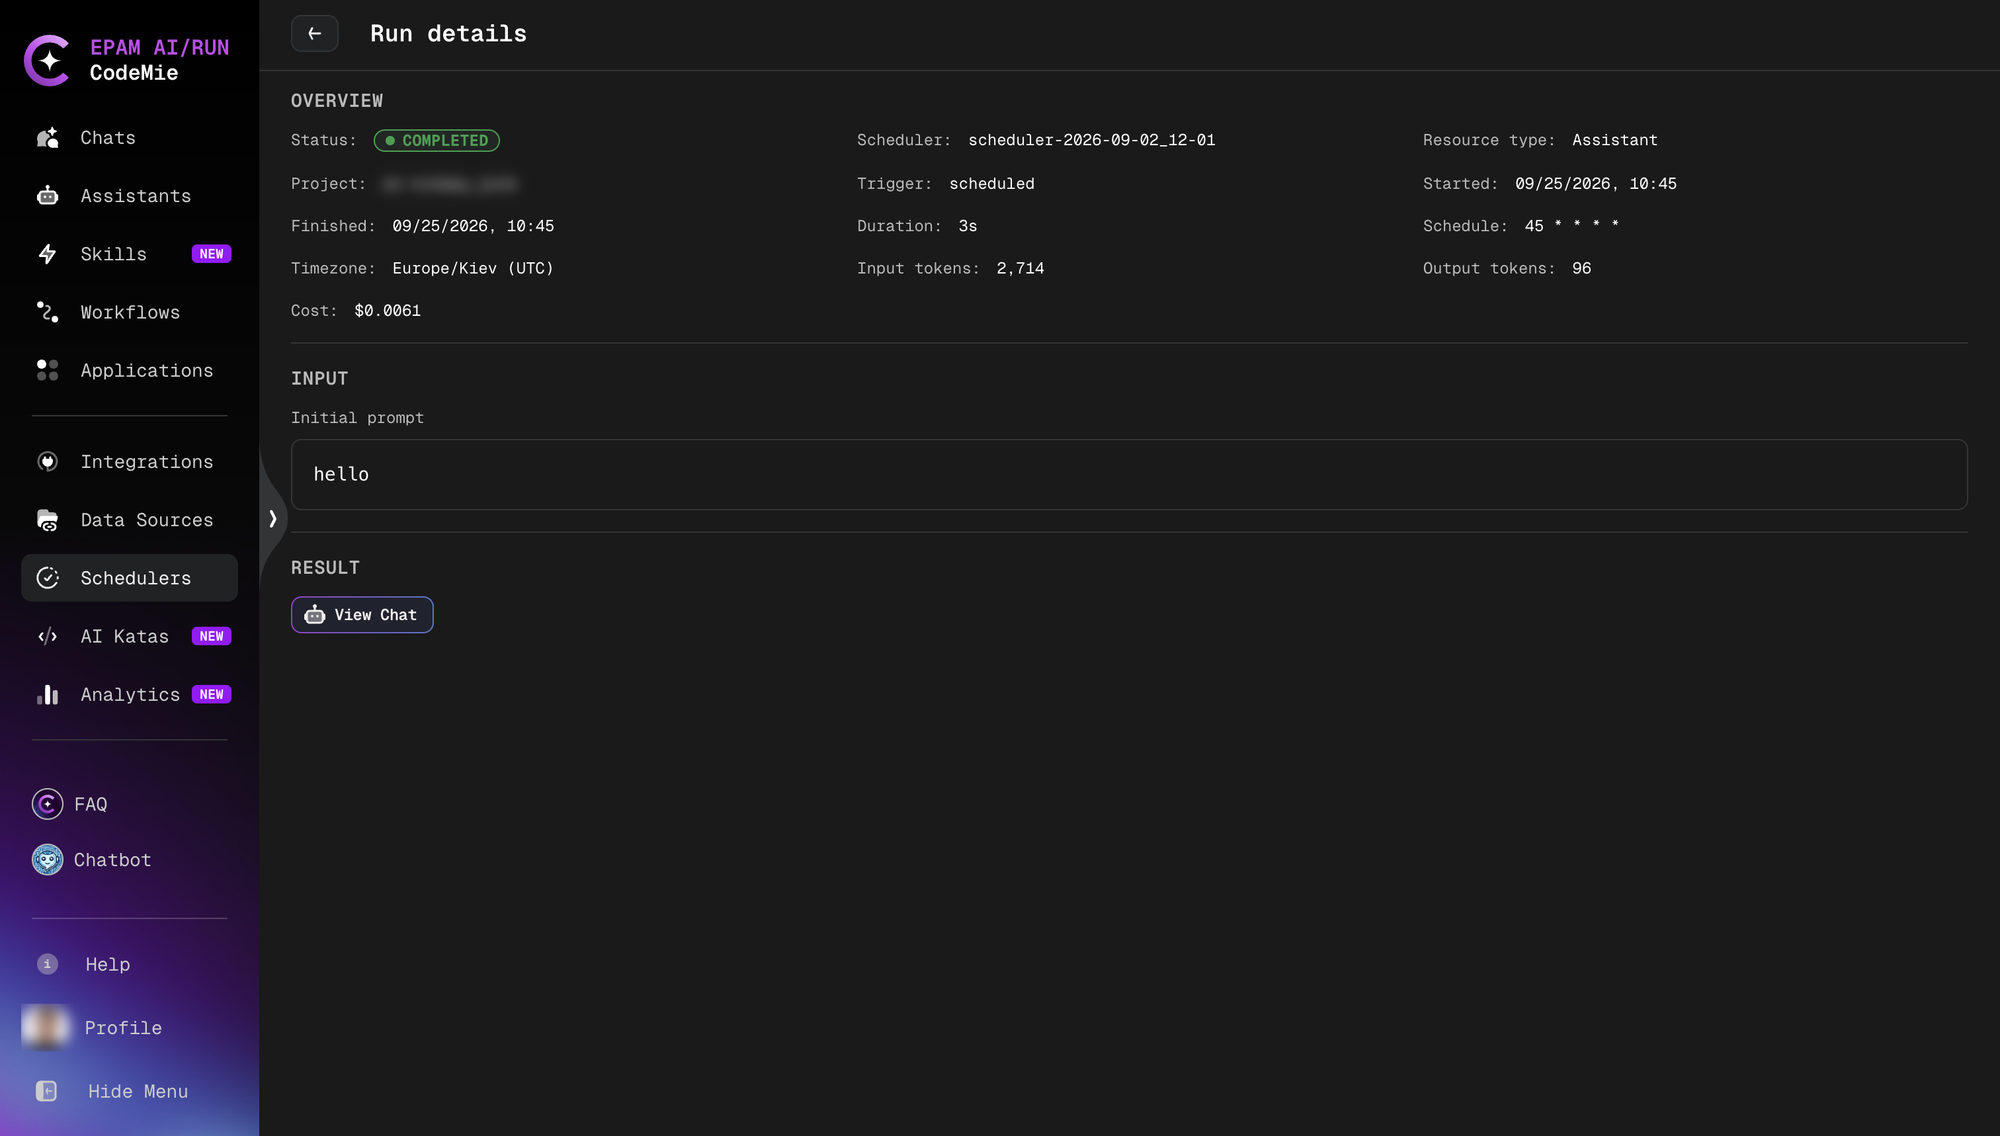
The Overview section shows:
| Field | Description |
|---|---|
| Status | COMPLETED |
| Scheduler | Name of the scheduler that triggered the run |
| Resource type | The type of resource that was executed (Assistant, Workflow, or Datasource) |
| Project | The project context |
| Trigger | scheduled for automatic runs |
| Started / Finished | Start and end timestamps |
| Duration | Total execution time |
| Timezone | The timezone in which the schedule was evaluated |
| Input tokens | Number of tokens consumed as input |
| Output tokens | Number of tokens generated as output |
| Cost | Estimated cost of the run in USD |
| Schedule | The cron expression that produced this run |
Input section — For Assistant and Workflow schedulers, the initial prompt provided when the scheduler was configured is shown here.
Result section — Links to the resource that was produced:
- Assistant runs include a View Chat button that opens the assistant chat session created by this run.
- Workflow runs link to the workflow execution.
- Datasource runs link to the data source.
Failed Run
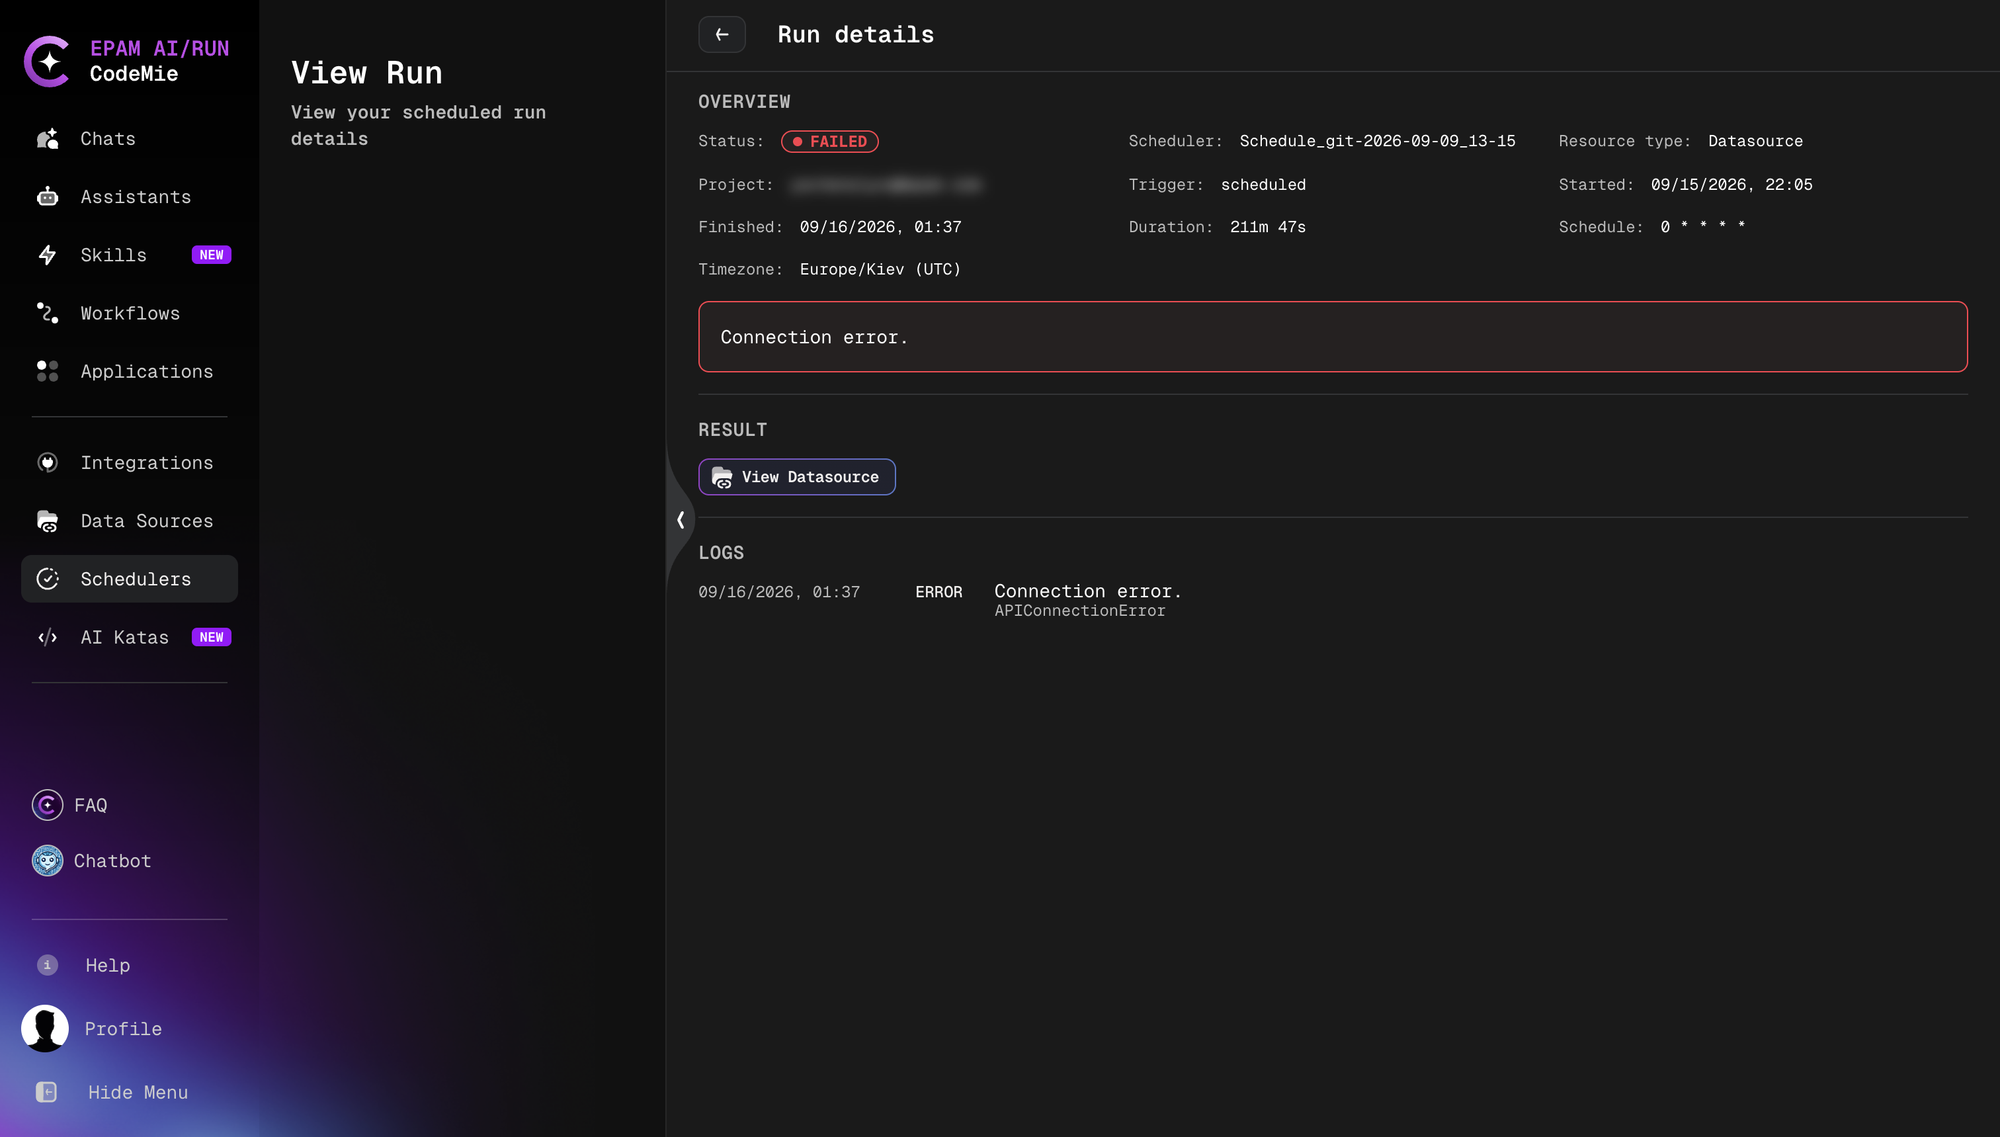
Failed runs display the same overview fields, with Status shown as FAILED. An error message is highlighted in a red box at the top of the page.
The Logs section lists chronological log entries with timestamps, error codes, and messages to help diagnose the cause of failure.
The Result section links to the associated resource (e.g., View Datasource) so the resource configuration can be inspected directly.
When a run fails, check the Logs section for error codes such as APIConnectionError or Connection error. These typically indicate a connectivity issue with the resource (e.g., a data source that is no longer reachable). Verify the resource configuration and re-run manually to confirm the issue is resolved before relying on the schedule again.