Analytics Dashboard
The Analytics Dashboard provides comprehensive monitoring and management of LLM usage, costs, and activity metrics across the CodeMie platform. Access real-time insights into token consumption, spending patterns, and system utilization with flexible filtering and dual visualization modes.
Accessing the Analytics Dashboard
To access the Analytics Dashboard:
- Click on the Analytics icon in the left sidebar navigation
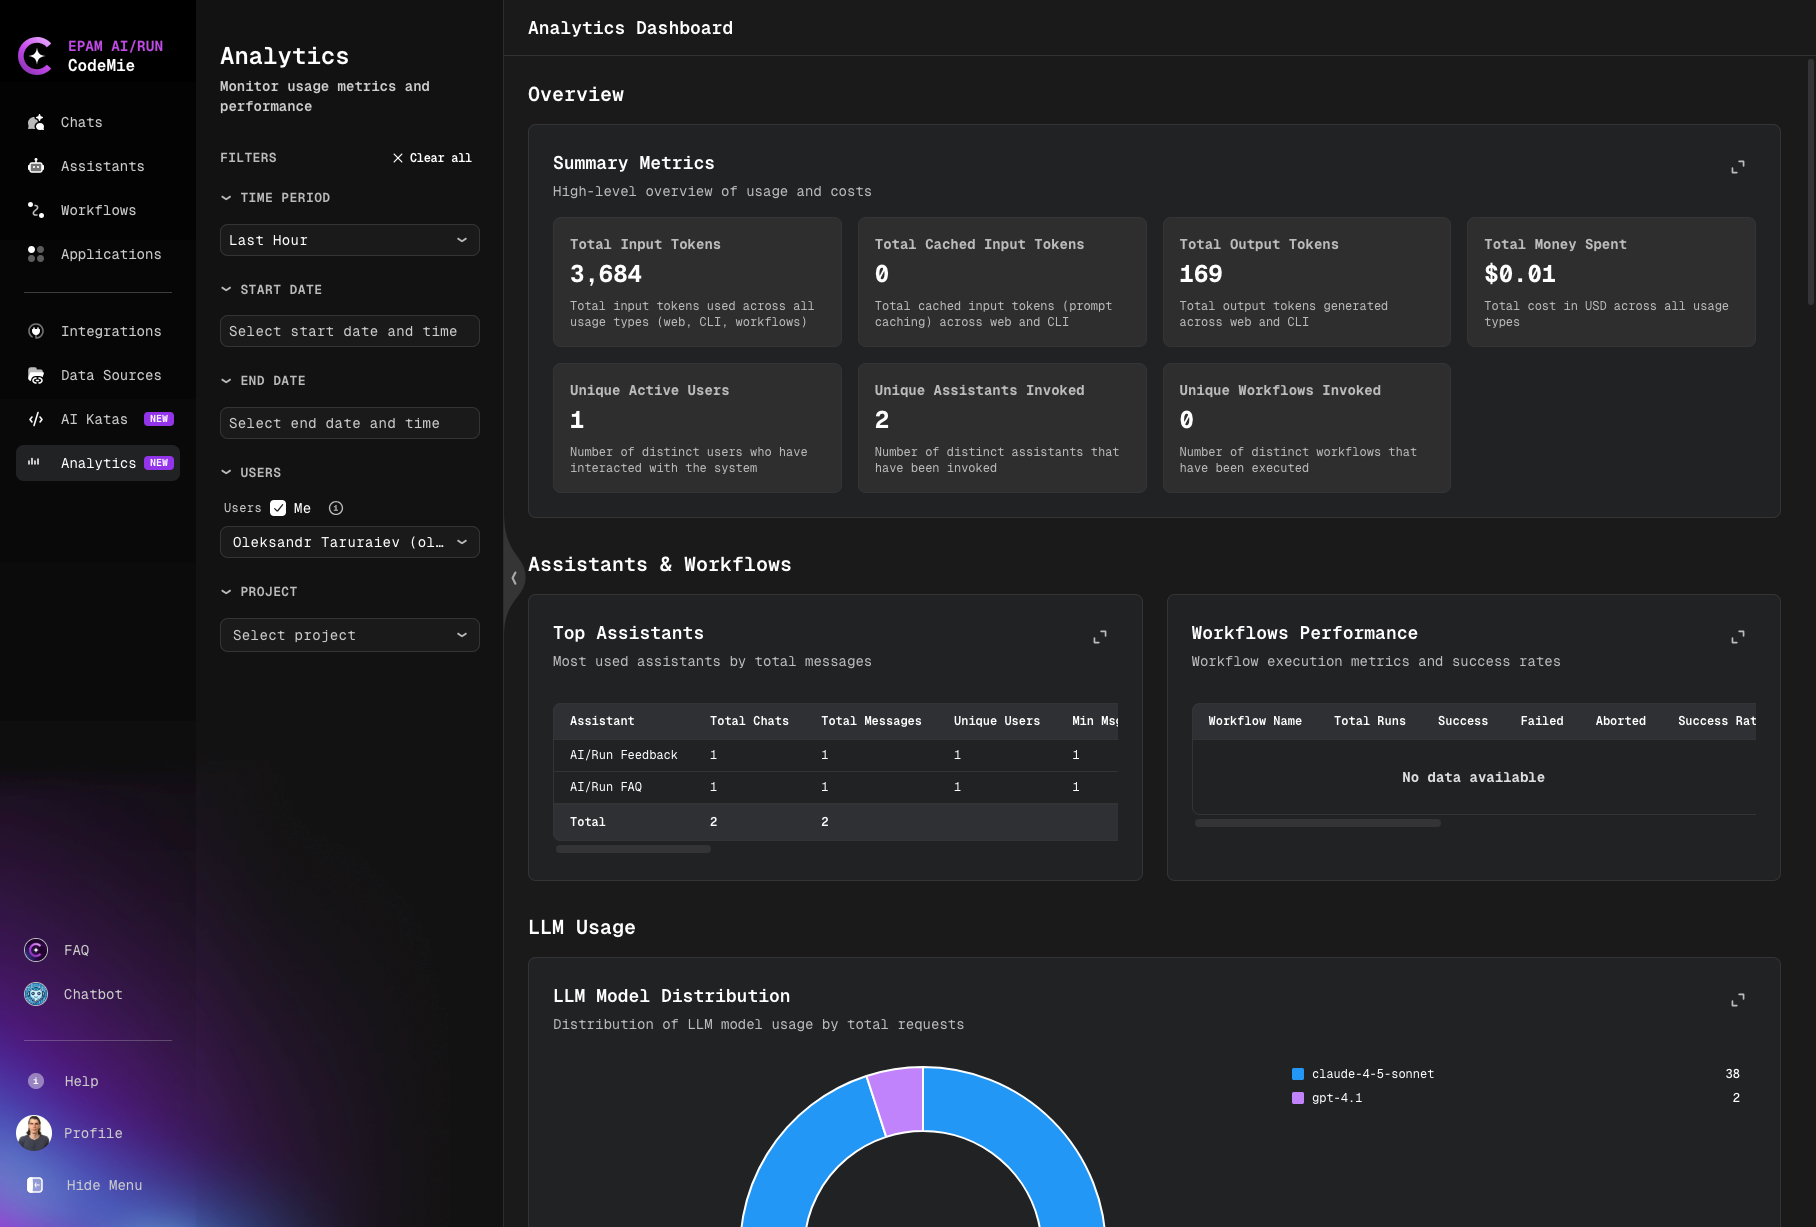
The Analytics Dashboard will open, displaying comprehensive monitoring and management tools for LLM usage, costs, and activity metrics.
Access Permissions and Data Visibility
The Analytics Dashboard data visibility depends on your user role and permissions defined in JWT attributes:
Regular Users
Regular users without admin privileges:
- View only personal statistics (your own usage and costs)
- Access data related to your individual activity
- Monitor your own assistants, workflows, and tool usage
Admin Role (isAdmin)
Users with the isAdmin role have full access to analytics data across the entire CodeMie platform:
- View statistics for all projects in the organization
- View statistics for all users using CodeMie
- Access complete platform-wide usage and cost metrics
- Monitor all assistants, workflows, tools, and integrations
Project Admin Role (applications_admin)
Users with applications_admin permissions have limited access to analytics data:
- View statistics only for projects where you are a Project Admin
- View data for all users within your managed projects
- Monitor usage and costs specific to your projects
- Access project-level metrics for assistants and workflows
To view analytics for projects or other users, you need either the isAdmin role or applications_admin permissions for specific projects. Contact your administrator if you need broader access to analytics data.
Global Filtering System
The Analytics Dashboard features a powerful filtering system that allows you to narrow down data across all dashboard sections simultaneously.
Available Filters
Time Period Filter
- Presets: Quick selection options
- Last Hour
- Last N Hours (customizable)
- Last N Days (customizable)
- Last Month
- Custom Range: Select specific start and end dates with time
- Start Date: Choose date and time
- End Date: Choose date and time
User Filter
- Multi-select dropdown with autocomplete
- Filter by specific users or select "Me" to view your own activity
- Combine multiple users for comparison
Project Filter
- Multi-select dropdown with autocomplete
- Filter analytics by specific projects
- View project-specific usage and costs
Filter Behavior
- Combined Filtering: All active filters work together to refine data
- Persistent Selections: Filter choices remain active as you navigate between dashboard sections
- Clear All: Reset all filters with a single action using the "Clear all" button